| Candidate | Party | Win % |
|---|---|---|
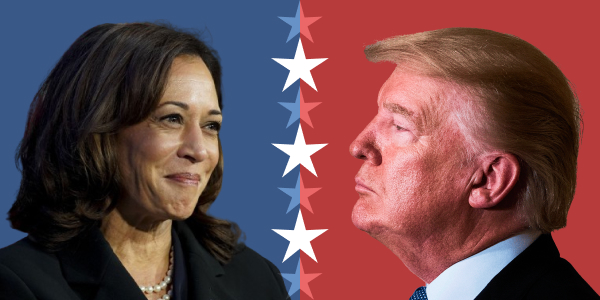
Kamala Harris | 82% | |
Donald Trump | 18% |
View the archived 2024 forecast
Chance of winning undefined over time
Our model is updated every day, blending the latest data on polls and fundraising with "fundamental" factors like incumbency and each district's partisan lean. Below is a chart over time of our best estimate of the most likely number of House seats each party will win, surrounded by a range of other plausible outcomes.
About undefined
Campaign Finance
An overview of each candidate's financial activity during the campaign, showing how much money they raised and spent. Campaign finance data can be a powerful indicator of a candidate's support base and overall campaign health.
| Candidate | Cash on hand | Raised | Spent | Report | Date |
|---|---|---|---|---|---|
Kamala Harris | $118,825,510 | $504,663,253 | $880,198,347 | October 16, 2024 | |
Donald Trump | $36,214,682 | $54,519,239 | $354,932,583 | October 16, 2024 |
Candidate
Cash on hand
$118,825,510
Raised
$504,663,253
Spent
$880,198,347
Report
Date
October 16, 2024
Candidate
Cash on hand
$36,214,682
Raised
$54,519,239
Spent
$354,932,583
Report
Date
October 16, 2024
Past Elections
This section displays the previous election results in previous elections for . By examining past election results, we can assess the historical performance and voter preferences in the state. This information is crucial for understanding trends and potential shifts in voter support.
| 2020 President | Vote % | Total Votes |
|---|---|---|
Joe Biden | 52.25% | 176,468 |
Donald Trump | 45.71% | 154,377 |
Jo Jorgensen | 2.05% | 6,909 |
2020 President
Joe Biden
Vote %
52.25%
Total Votes
176,468
2020 President
Donald Trump
Vote %
45.71%
Total Votes
154,377
2020 President
Jo Jorgensen
Vote %
2.05%
Total Votes
6,909
+ More Elections
Featured Races
Explore the latest probabilities in the most competitive presidential, Senate, and House races by selecting any of the races listed below.
Interested to see how the DDHQ/The Hill forecast works? Read our methodology statement.


